Alpha and Beta, Explained on One Stock
Beta measures how much a stock moves with its benchmark; alpha is the return left over that the benchmark doesn't explain. Both are only ever true relative to the benchmark you pick — and on one real stock, changing the benchmark flips the answer.
Beta and alpha are the two numbers that describe how a stock behaves relative to a benchmark. Beta measures sensitivity: a beta of 1 means the stock tends to move one-for-one with the benchmark, a beta of 2 means it tends to move about twice as much (up and down), and a beta below 1 means it moves less. Alpha is what's left over: the return the stock earned beyond what its beta and the benchmark's return would predict. Positive alpha means it did better than its risk exposure alone would explain; negative alpha means worse. Both numbers only mean something relative to a stated benchmark — and that is the part most definitions skip.
A worked example: AMD vs the market
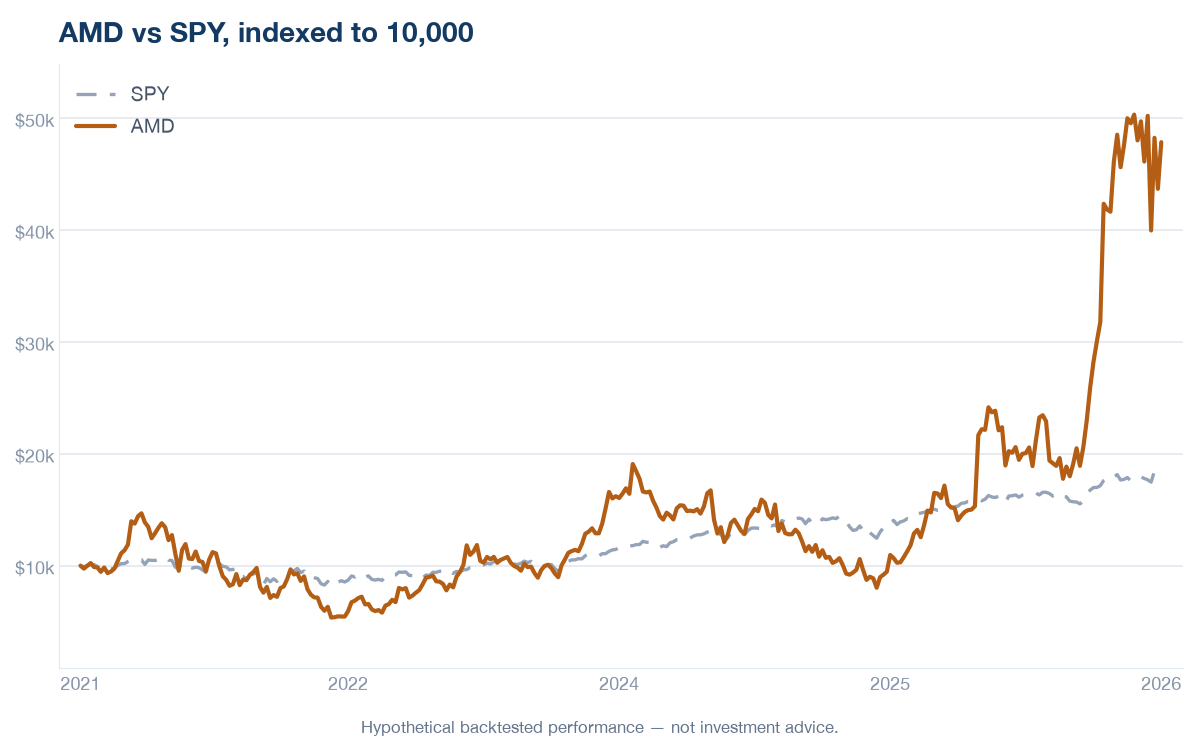
Over the 5-year window (2021–2026) (as of August 15, 2026), AMD returned 37.0% a year. Measured against the broad market (S&P 500) (SPY), it had a beta of 2.15 — it swung about twice as hard as the index — and an alpha of +11.9% a year: it earned more than that beta and the market's 13.3% return would predict.
Now change the benchmark
Here is the part a dictionary entry misses. Measure the same stock over the same window against its own sector (semiconductors) (SMH) instead, and both numbers change. AMD's beta drops to 1.24 — against a basket of its own peers it no longer looks unusually swingy, because the whole sector moves together — and its alpha turns to -7.2% a year. The reason is in the last row of the table: SMH itself returned 36.1% a year versus SPY's 13.3%, so the bar AMD is measured against is far higher.
| Measure | vs SPY | vs SMH |
|---|---|---|
| Beta | 2.15 | 1.24 |
| Alpha (annualized) | +11.9% | -7.2% |
| Benchmark's return (annualized) | 13.3% | 36.1% |
Same stock, same window, two defensible benchmarks — and beta nearly halves while alpha flips from positive to negative. Against the broad market AMD looks like a high-beta winner; against its own sector it moved roughly with its peers and, risk-adjusted, lagged them. Neither number is 'wrong'; they answer different questions, and the benchmark is the question.
How to read them
Whenever you see an alpha or a beta quoted, the first question is 'against what?' A beta is a statement about co-movement with a specific index; an alpha is a claim of return beyond that index. Change the index and you change both. Reading them next to the benchmark's own return — as in the table above — keeps the comparison honest.
Run it on any stock
Beta against a benchmark, and a security's return versus that benchmark, are exactly what the tool computes. Enter a symbol and a benchmark below to see the beta of a stock you follow — then switch to a second benchmark and watch the number move, just as it did above. (The alpha figures here are the standard CAPM formula applied to the same return series — the method is in the notes below.)
Method & caveats
All figures as of August 15, 2026 over the 5-year window (2021–2026); a later re-run rolls the window forward and shifts the numbers. Beta is the covariance of the stock's daily returns with the benchmark's, divided by the benchmark's variance; alpha is the CAPM (Jensen's) alpha, annualized, using a 3% risk-free rate. Returns use adjusted close (dividends and splits included) and are gross — no fees, trading costs, slippage or cash yield are modeled. This is one stock against two benchmarks over one window — an illustration of how alpha and beta depend on the benchmark, not a general claim, and past results do not predict future returns.