Concentration Risk: When "Diversified" Isn't
You can hold six different household-name stocks and still own, in risk terms, a single bet. Here is a deliberately naive "looks-diversified" basket, decomposed into what it is actually exposed to — sector, market-cap tier, market beta, style tilt and where its risk really sits.
“I own six different companies — Apple, Microsoft, Alphabet, Amazon, Nvidia and Meta. That's diversified, right?” It is a reasonable instinct: more tickers feels like more diversification. But holding many tickers is not the same as holding many bets.
Diversification is about how little your holdings move together and how many genuinely different things you are exposed to — not how many line items are on the statement. To see the difference you have to decompose a portfolio into what it is actually exposed to, rather than counting its names. Below is a deliberately naive basket — AAPL, MSFT, GOOGL, AMZN, NVDA, META (equal-weighted) — run through the same portfolio-exposure decomposition QuantiBot.ai runs on your own holdings, over the 1-year window (2025–2026).
What “diversified” is supposed to mean
A genuinely diversified book spreads its money across different sectors, different sizes of company, and different drivers of return, so that no single event moves the whole thing at once. The count of holdings is a poor proxy for any of that. 6 names can be 6 independent bets — or, as here, 6 versions of the same bet. The only way to tell them apart is to look at the exposures, not the roster.
What the basket actually owns
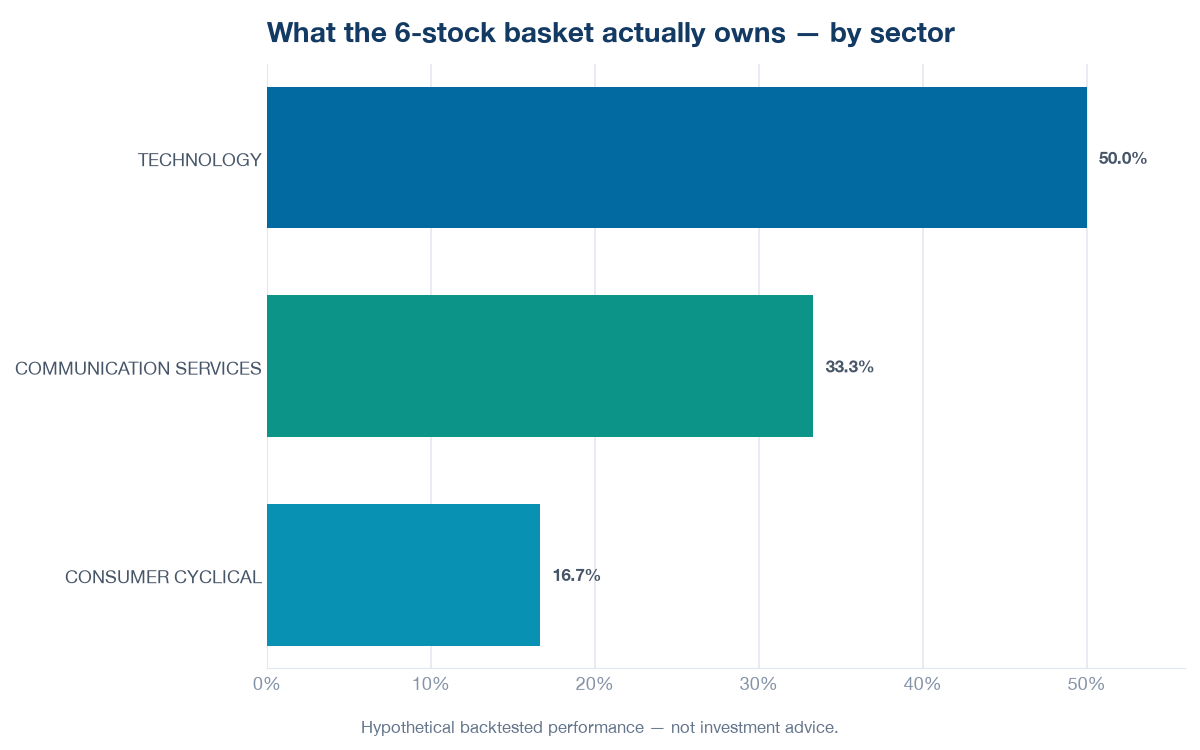
Group the 6 holdings by sector and the illusion starts to break. The single largest sector — Technology — is already 50% of the book, and the holdings cluster in a handful of adjacent sectors rather than spreading across the market. There is nothing here from the parts of the economy that tend to move differently.
One market bet, wearing six names
Two numbers show how alike these holdings really are. The first is beta — how much a holding tends to move when the market moves, where 1.0 means it moves in lockstep with it. Weighted across the basket, beta against SPY is 1.30: as a group, these six move almost exactly with the broad market — unsurprising once you notice they are several of that market's largest members.
The second is style — the handful of traits quant screens sort stocks by, such as value, momentum and quality. These holdings all lean the same way: each ranks higher than about 87% of the stocks we screen on Quality. Names that share a style tend to rise and fall together, so one rarely cushions another.
By a simple count of dollars, the basket looks as spread out as six holdings can be: its effective number of holdings — a concentration score where six equal positions score a full six, and one dominant position scores near one — is 6.0 of 6. Every position is a roughly equal slice, none dominating.
But spreading your dollars evenly is not the same as spreading your risk. Here, risk means volatility — how much the portfolio's value swings up and down over time; a holding adds more of it the more it swings on its own and the more tightly it moves with the rest.
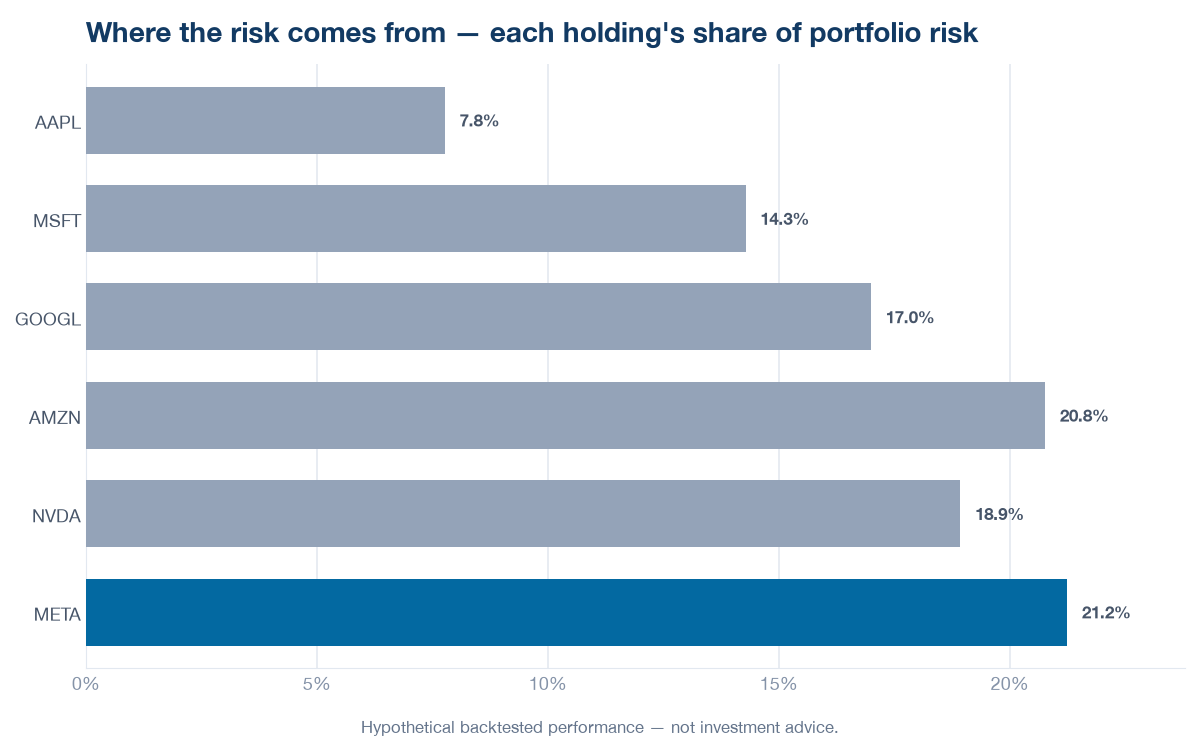
By that measure the basket is far less balanced. META alone accounts for 21% of the portfolio's total volatility, and the basket's own annualized volatility is 20.8% — roughly the size of a typical year's up-or-down swing. Six names this alike simply do not cancel one another out the way six genuinely different holdings would.
| Measure | What the decomposition shows |
|---|---|
| Holdings | 6 stocks, equal-weighted |
| Largest sector | Technology — 50% of the book |
| Weighted market beta (move vs SPY; 1.0 = in lockstep) | 1.30 |
| Shared style tilt | Quality — ranks above 87% of screened stocks |
| Effective number of holdings (by dollar weight) | 6.0 of 6 |
| Annualized volatility (size of a typical yearly swing) | 20.8% |
| Largest single position | AAPL at 17% |
| Biggest contributor to that volatility | META — 21% of the total |
The chart below shows the same point holding by holding — each name's share of the portfolio's total volatility (its “risk contribution”). Split evenly by dollars, the six do not split the risk evenly: the names that swing most, and move most tightly with the rest, carry more of it.
The takeaway
None of this says the basket is good or bad, or that concentration is a mistake — plenty of people hold concentrated books deliberately, with their eyes open. The point is narrower and purely factual: a portfolio's diversification lives in its exposures, not its ticker count. Six names that share a sector, a market beta and a style tilt are, in risk terms, close to a single position. The only way to know which kind of book you actually hold is to decompose it and look.
See what you actually own
The free Portfolio X-ray below lets you run the same kind of check on your own holdings — how concentrated they are and how much they actually move together — on real historical data, with no sign-up. The full exposure breakdown shown above is available inside the app.
Method & caveats
All figures are the output of QuantiBot.ai's portfolio-exposure decomposition on an equal-weighted basket of AAPL, MSFT, GOOGL, AMZN, NVDA, META, computed over the 1-year window (2025–2026) as of August 15, 2026, with market beta measured against SPY. Sector, industry and cap-tier weights are point-in-time; beta and factor percentiles are universe-relative ranks from the screener; risk contribution is each holding's marginal contribution to portfolio volatility (MCTR) from the annualized covariance matrix. Figures use adjusted-close returns and are gross — no fees, trading costs, slippage, taxes or idle-cash yield are modeled — so a real account would differ. This is one illustrative basket over one window: an illustration of the method, not a claim about these particular securities, and past exposures and volatility do not predict future results. Nothing here is investment advice or a recommendation to buy, sell or hold any security.