How to Backtest a Portfolio
Choosing holdings and weights, why the rebalance cadence changes the result, and which metrics read differently for a whole portfolio than for one stock — worked on a simple three-holding example.
Backtesting a portfolio asks a different question than backtesting a single stock. Instead of one price series, you have several holdings, a set of weights, a rule for keeping those weights on track, and a benchmark that has to be a fair yardstick for the mix. This walkthrough covers those portfolio-specific choices on a simple 3-holding example. It assumes you already know what a backtest is and what its results can and cannot tell you — if not, start with what a backtest measures and come back.
Holdings and weights
A portfolio backtest starts with the holdings and how much of each you hold. Our worked example is a three-fund style mix: VTI 60%, VXUS 30%, BND 10%. The weights are the first thing that shapes the result — the same three funds at 33/33/33 would trace a different curve than VTI 60%, VXUS 30%, BND 10%. A backtest lets you see the historical consequence of a specific weighting rather than guessing at it.
Rebalancing cadence changes the result
Left alone, winners grow to dominate the mix and the portfolio drifts away from its target weights. Rebalancing periodically sells back to target and tops up the laggards. How often you do it is itself a choice that changes the outcome: rebalancing more often holds the weights tighter but trades more; rebalancing less often lets winners run further. This example rebalances quarterly. Changing that cadence — monthly, quarterly, annually, or never — is one of the levers a backtest is most useful for, because the effect is rarely obvious in advance.
A worked example
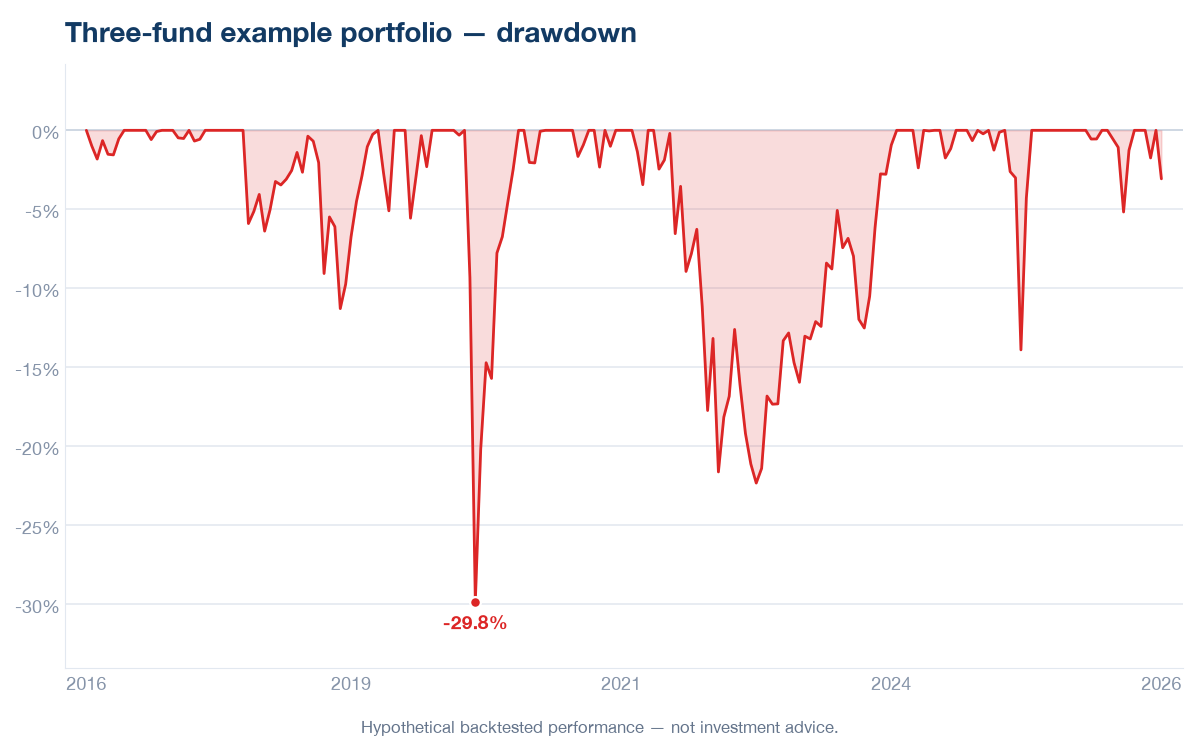
Here is the Three-fund example portfolio (VTI 60%, VXUS 30%, BND 10%), rebalanced quarterly, run against SPY over the 10-year window (2016–2026) (as of August 15, 2026). Over that window it returned 213.0% versus SPY's 316.3%, with a worst peak-to-trough drawdown of 31.2% against the benchmark's 33.7%.

Portfolio metrics read differently
The metrics you already know from single securities mean something slightly different at the portfolio level. Total return is the blended result of every holding and every rebalance, not any one fund's return. Max drawdown is the worst decline of the combined portfolio — usually shallower than the worst holding's, because the holdings rarely bottom together, and that diversification is exactly what a portfolio backtest lets you measure. The drawdown curve below shows the combined portfolio's decline from its running peak.
| Metric | Three-fund example portfolio | SPY |
|---|---|---|
| Total return | 213.0% | 316.3% |
| Max drawdown | 31.2% | 33.7% |
| Sharpe ratio | 0.62 | 0.72 |
Choosing a benchmark
A single stock is easy to benchmark against its sector or the market. A multi-holding portfolio is harder: a US-and-international-and-bonds mix measured only against SPY (US large-cap stocks) will look different in a year when international or bonds lead. The point of naming the benchmark explicitly is that every comparison above is relative to it — pick one that resembles the risk of the mix, and read the numbers as a comparison, not a verdict.
Measure your own portfolio's diversification
That shallower combined drawdown comes from diversification — how little the holdings move together — and you can measure it directly rather than infer it. The free Portfolio X-ray below takes any set of holdings and shows how correlated they are, how concentrated the mix is, and how much genuine diversification you actually get. (It analyzes the make-up of a portfolio; to backtest historical performance with your own weights and rebalancing, use the full portfolio backtester in the app.)
Method & caveats
All figures as of August 15, 2026 over the 10-year window (2016–2026); a later re-run rolls the window forward and shifts the numbers. Returns use adjusted close (dividends and splits reinvested) and are gross — no fees, trading costs, slippage, taxes or idle-cash yield are modeled, so a real account would differ. Rebalancing is quarterly. This is one illustrative portfolio over one window against one benchmark — an illustration of the mechanics, not a general claim, and past results do not predict future returns.