What Is a Trading Agent? How It Works, What It Takes to Get Right, and How to Lead the Research Yourself
How AI trading agents observe, decide and place orders, where they go wrong, and a worked example of leading a fundamental analysis yourself.
What a trading agent is
A trading bot follows a rule somebody wrote: when the 50-day average crosses the 200-day, buy. A trading agent is given a goal instead of a rule, and works out the steps for itself.
Under the hood, most trading agents run the same loop:
- Observe. Pull in prices, fundamentals, news and the current state of the account.
- Reason. A language model reads what came in and decides what it means: is this a setup worth acting on, and how big a position?
- Act. It calls tools: a data feed, a calculator, a backtest, and finally a brokerage API that places the order.
- Check and repeat. It reads the result (filled or not, up or down) and goes around again, minutes or days later.
That last step is what makes it an agent. Nobody scripted the sequence; the model chooses which tool to call next and when it is done. Point one at "find quality companies that have sold off and buy the ones that held up best in 2022" and it will screen, compare, test, size and trade, all on its own judgement.
The idea has gone from a curiosity to one of the fastest-growing topics in investing in about a year, and open-source projects that wire AI models to brokerage accounts have multiplied alongside it. The appeal is easy to see: a weekend of research and a trading desk's worth of attention, running all the time.
What it takes to get one right
The demo takes an afternoon. A trading agent you would trust with real money is a different project, and these are the places it usually goes wrong.
Bad data in, confident trades out. Raw prices that aren't adjusted for splits and dividends make every historical return wrong. A stock universe taken "as it is today" leaves out every company that failed, so any strategy looks better than it really was. Fundamentals get restated and tickers get reused. None of this shows on a chart, and an agent will happily trade on all of it.
Made-up numbers. Ask a language model for a P/E ratio and it will give you a plausible one whether or not it has the data. In a chat that's an annoyance. In an agent that chains ten steps, a made-up figure in step three becomes the input to step four, and then the reason for an order.
Backtests that flatter. Let an agent test enough variations and one will look brilliant by chance. Leave out trading costs and slippage, and a strategy that churns looks profitable when it isn't. Live results then drift away from the test, and an agent has no instinct to notice.
Silent breakage. Data providers change their feeds, model updates change behaviour overnight, and rate limits cut requests off halfway. A prompt that worked in March makes different decisions in June. Unless something checks the agent against known answers every day, nobody finds out until the account does.
Losing the wheel. The more an agent is allowed to do, the less you see. A research mistake costs an evening. An execution mistake happens at 3 a.m., at machine speed, on a number nobody checked. Getting this right means hard limits on position size and losses, a kill switch, and a person who can see why each trade happened.
None of this makes trading agents a bad idea. It means the hard part isn't the model. It's the data, the testing, the limits and the oversight around it.
If you want more control, lead the research yourself
A fully autonomous agent asks you to trust every step you can't see. If you'd rather stay in control and have confidence in each step, there's another way to use the same technology: lead the analysis yourself.
With QuantiBot.ai, you ask research questions in conversation, one at a time, the way you'd work through an idea with an analyst. You choose what to screen for, which names to look at closer, which risks to check and which conditions to watch. Each answer comes back as data you can inspect before you ask the next question. You stay the one deciding what matters and what to do about it. A free account is enough to start.
Let me show you: a fundamental analysis, step by step
Here is how you might approach a fundamental analysis this way, from a broad screen to a short list of conditions to watch. The prompts are exactly as typed and the screenshots are from one session, with data as of the October 16, 2026 close.
Not investment advice. The companies in this article came out of an example screen. Nothing here is a recommendation to buy, sell or hold any security mentioned. The point is the process, not the names. Some of the features shown may require a paid subscription.
1. Start with a screen on your own criteria.
Screen US large caps for quality and value: P/E under 18, free-cash-flow yield above 5%, ROIC above 12%, market cap over $10B.
You get a ranked list of the companies that pass every filter you set, with a column for each one so you can check them.

2. Look at the trend, not one quarter.
Take the top five. Compare revenue growth, operating margin and free-cash-flow margin over the last eight quarters.
A single quarter can flatter any company. Two years of revenue growth, margins and cash conversion show whether the numbers that passed the screen are steady or a blip.

3. Check the risk, including a bad year.
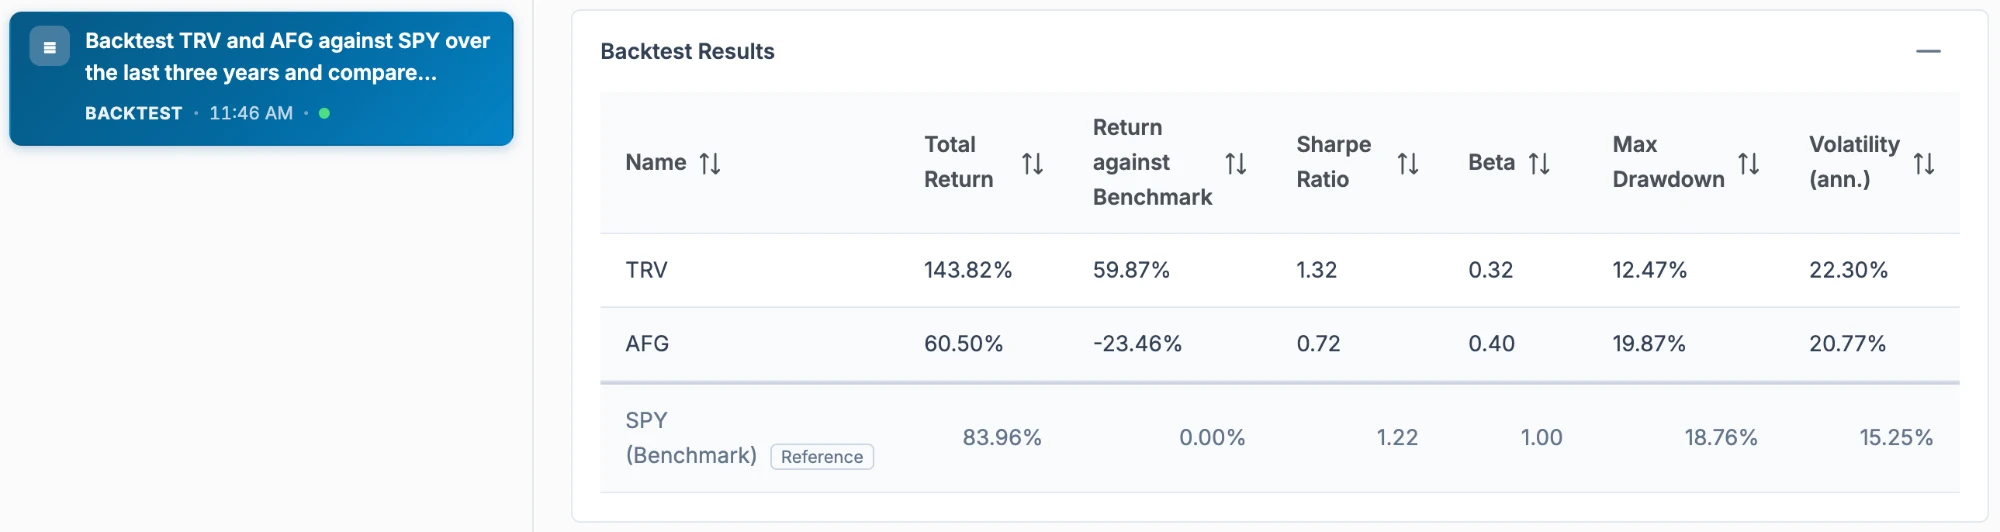
Backtest TRV and AFG against SPY over the last three years and compare volatility, beta and max drawdown.
How much each name moved, how closely it tracked the market, and how far it fell from a peak, side by side with SPY.
How did TRV and AFG do against SPY in 2022?
A calm three years can hide how something behaves under stress. 2022 shows each name through a falling market.

4. Check what it overlaps with.
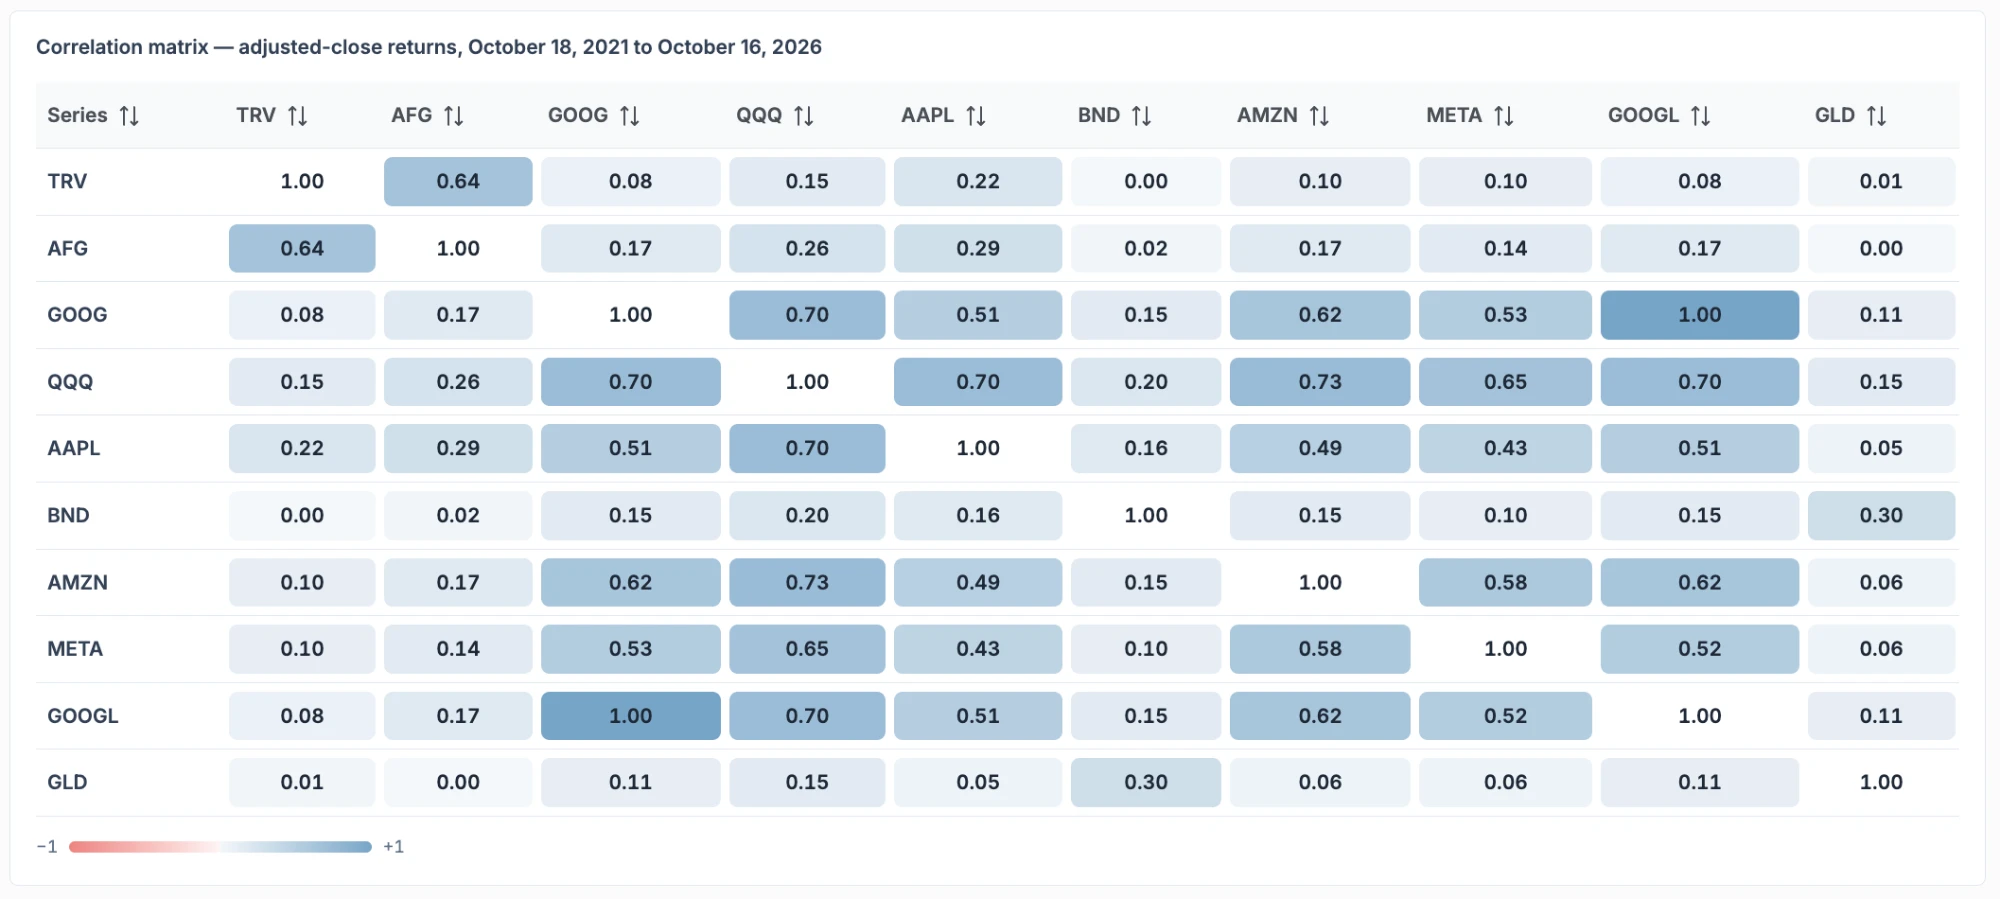
How correlated are those two with each other and with my watchlist?
A name that moves with what you already follow adds less than it seems. A correlation matrix against your own watchlist shows that before you go further.
5. Read the current technical picture.
Show RSI, MACD and the 50/200-day averages for TRV right now.
Fundamentals tell you what a business is. Momentum and moving averages tell you where the price stands today.

6. Decide your own conditions, and let them be watched.
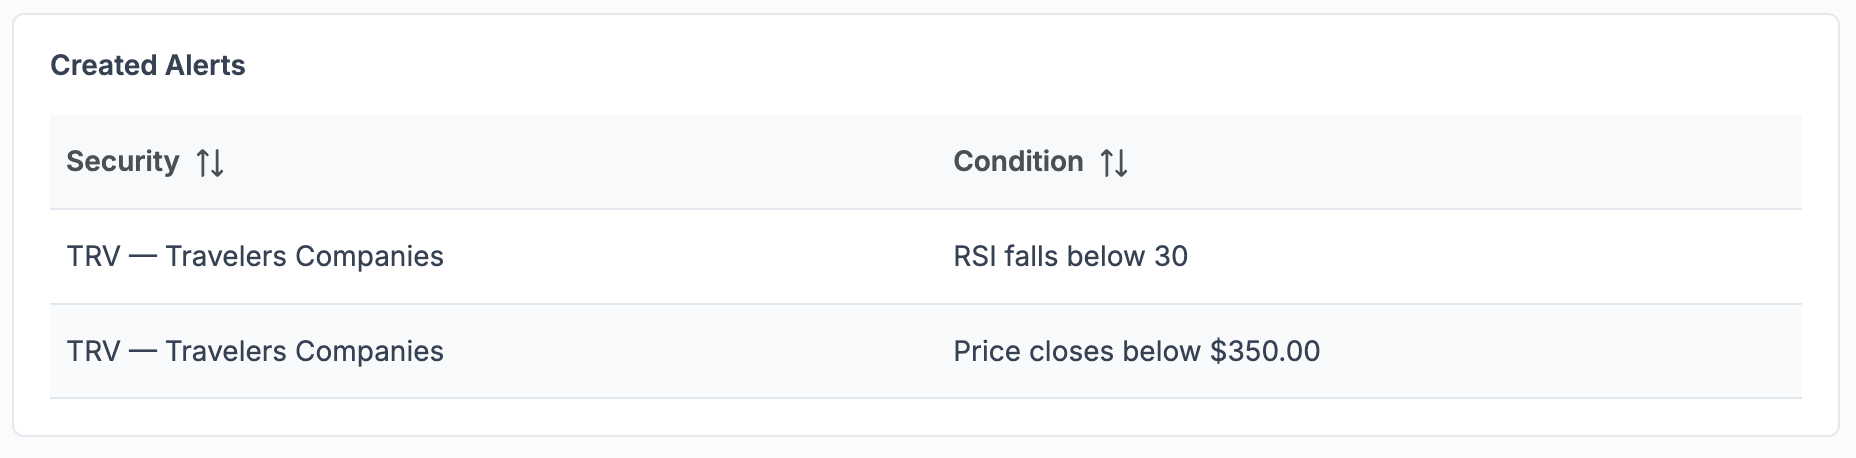
Alert me if TRV RSI drops under 30, or it closes below $350.
The thresholds are yours. You're told when one is met, and what to do then is still your call.
Six steps took this from a broad screen to a short list with known risks and conditions you chose. At every step you could see the data and decide the next question. That's the difference between leading the research and handing it off.
Create a free account and run your own research →
Disclaimer — For informational and educational purposes only — not investment advice or a recommendation to buy, sell, or hold any security. Outputs are general in nature and not tailored to your individual financial situation. QuantiBot.ai is not a broker-dealer or investment adviser. Market data and AI-generated analysis come from third-party sources, may be delayed or inaccurate, and may contain errors. Backtests and simulations are hypothetical and do not predict or guarantee future results. You are solely responsible for your own investment decisions; verify any information before relying on it.