What Is Correlation in a Portfolio?
What a correlation of 0.9 means in practice, how to read a correlation matrix, and why a low pairwise number can still leave you concentrated — worked on six well-known holdings.
Correlation measures how two holdings tend to move relative to each other. It runs from +1 to −1. At +1 two securities move in lockstep — when one rises, so does the other, by a proportional amount. At −1 they move exactly opposite. At 0 their day-to-day moves have no linear relationship: knowing what one did tells you nothing about the other. Most stock pairs sit somewhere in the positive middle, because they share exposure to the same overall market. The point of measuring it is simple: two holdings that move together give you less diversification than their count suggests, and correlation is how you see that instead of guessing at it.
How correlation is measured here
Every number in this post is computed on adjusted-close daily returns — the day-over-day percentage change of each security's dividend- and split-adjusted price — over a 5-year window (2021–2026) ending August 15, 2026. Correlating returns rather than raw price levels is what makes the comparison meaningful: two rising prices will look correlated just because both trend up, while their returns reveal whether they actually move together day to day. This is the same basis QuantiBot.ai uses for its performance and beta figures (computed on adjusted-return basis), so the numbers here line up with the rest of the site.
Reading a correlation matrix
A correlation matrix puts every holding on both axes and fills each cell with the pairwise correlation of that row and column. The diagonal is always 1.00 — every security is perfectly correlated with itself — and the matrix is symmetric, so the cell for A-versus-B equals the cell for B-versus-A. You read it by scanning for the darkest cells (strong positive correlation, holdings that move together) and the faintest or red cells (weak or negative correlation, holdings that offset). Below is the matrix for six well-known holdings — SPY, QQQ, AAPL, MSFT, TLT and GLD — over the window.

What 0.9 looks like
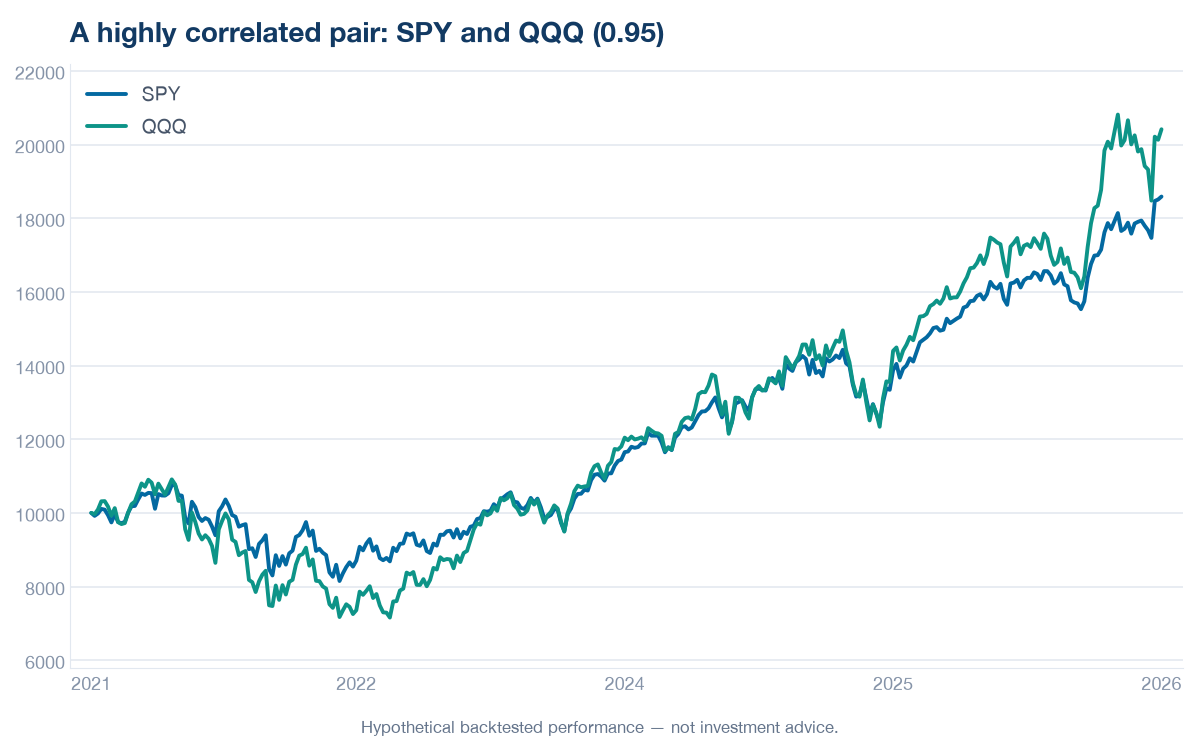
The most correlated pair in the matrix is SPY and QQQ, at 0.95. A number that close to 1 means the two moved almost as one over the window: on a typical day they rose or fell together, and by similar amounts. Indexed to the same starting value, their price paths trace nearly the same line.
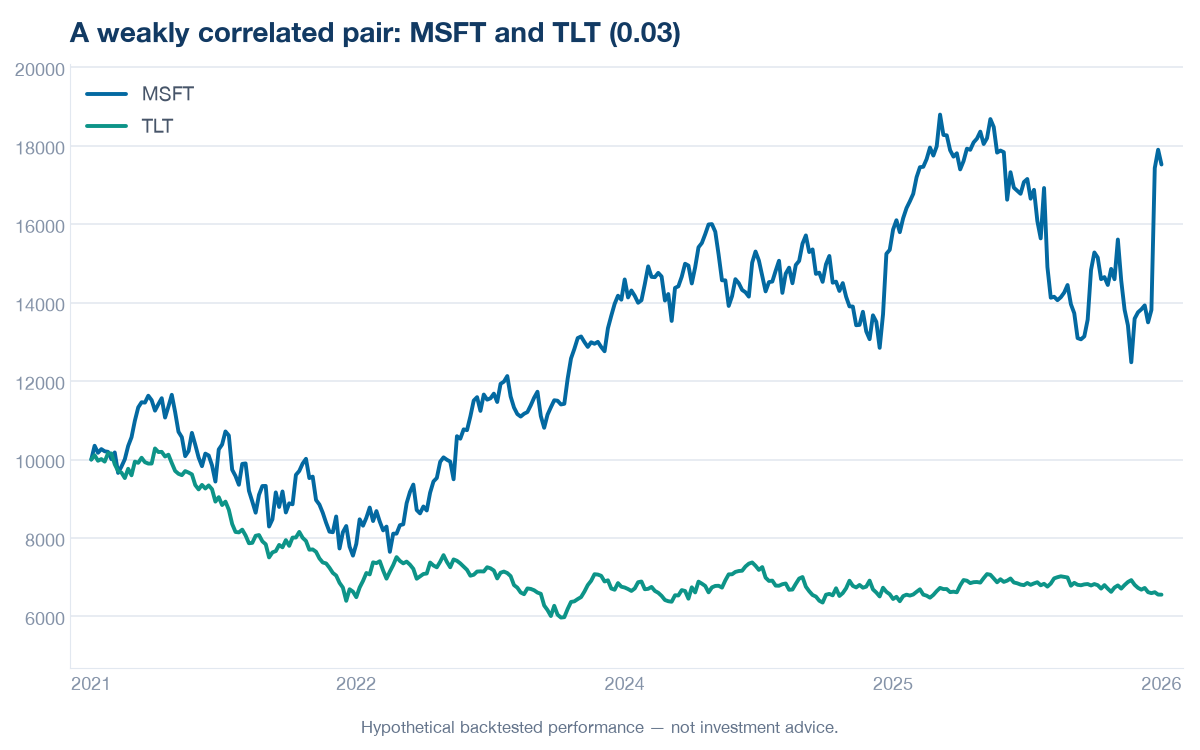
The least correlated pair is MSFT and TLT, at 0.03 — far lower. Their returns had little to no linear relationship over the window, so their indexed paths wander independently: one can be climbing while the other drifts sideways or falls. That independence is what genuine diversification looks like on a chart.
Why a low pairwise number can still leave you concentrated
Here is the trap. It is tempting to look at a single low number — MSFT and TLT at 0.03 — and conclude the book is well diversified. But correlation is pairwise, and a portfolio is more than one pair. The average correlation across all pairs of these six holdings is 0.35. Several of the names — the large-cap equity holdings especially — correlate strongly with one another because they all load on the same underlying driver: the direction of the broad stock market. A handful of names that each move largely with the market is closer to holding one big market bet several times than to holding several independent bets, no matter how low a single unrelated pair scores. Reading the whole matrix — and the average, not just the lowest pair — is how you catch concentration a single number hides.
| Pair | Correlation (5-year window (2021–2026)) |
|---|---|
| SPY and QQQ — most correlated | 0.95 |
| MSFT and TLT — least correlated | 0.03 |
| Average across all pairs | 0.35 |
Measure your own holdings' correlations
You can run this on your own holdings rather than eyeball it. The free Portfolio X-ray below takes any set of securities and shows how correlated they are, how concentrated the mix is, and how much genuine diversification you actually get. The user names the holdings; the tool just reports what the historical data shows.
Method & caveats
All correlations are computed on adjusted-close daily returns over the 5-year window (2021–2026), as of August 15, 2026; a later re-run would roll the window forward and shift the numbers. Adjusted close reinvests dividends and splits, and the return series are gross — no fees, trading costs, slippage, taxes or idle-cash yield are modeled. Correlation is a historical, linear statistic: it measures how these securities moved together over this one window, not how they will move next, and it says nothing about the size or direction of returns. Correlations are also not stable — pairs that look independent in calm markets often spike toward 1 in a sell-off, which is the subject of a follow-up post. This is an illustration of how to read the number, not a claim about any security. Past relationships do not predict future ones.