
Correlation & Portfolio Diversification Analysis
Understand what really drives your portfolio's risk.
Two holdings can look different and still rise and fall together. QuantiBot.ai measures how your securities actually move relative to one another, and breaks down where a portfolio is concentrated — so diversification is something you can see, not just assume. It is the difference between a portfolio that looks diversified on paper and one that actually spreads its risk. It works on a portfolio you hold or any set of names you supply, over a window you choose, so you can check overlap before you add a position rather than after.
🔒 Secure payment. No charge for 7 days. Cancel anytime.
- Conversational research
- No coding required
- For every investor
- Thousands of stocks & ETFs
- Company fundamentals
- Technical indicators
- Historical backtesting
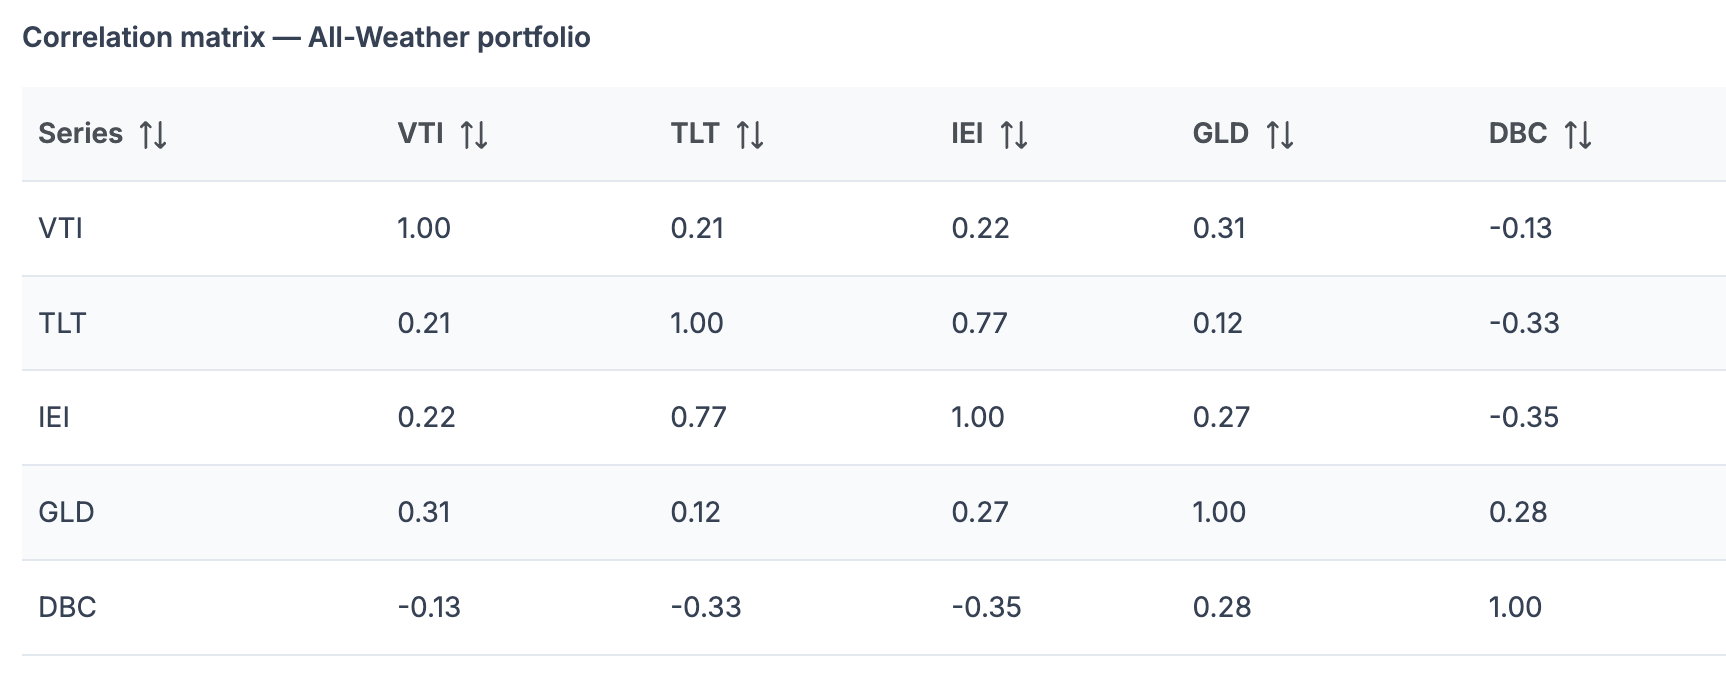
Measure correlation between securities
Put a number on how much your holdings actually move together:
- Pairwise correlation — between named securities over a window you choose.
- Across a whole portfolio — see which positions duplicate each other's exposure.
- Overlap made concrete — two names that sound distinct can still move in lockstep.
- Positive and negative — see what moves together and what actually offsets, not just what looks different.
Decompose your portfolio's exposure
Go beyond ticker-level detail to the drivers of how a portfolio behaves:
- Sector & factor exposure — where the portfolio is really tilted.
- Concentration — where a handful of positions dominate the risk.
- Before the drawdown — spot it up front, not after the fact.
- Factor tilts named — value, growth, size, and volatility leanings made explicit.
Why diversification is more than a count of holdings
Holding more tickers is not the same as spreading risk. Correlation and exposure show whether a portfolio is genuinely diversified or just long the same bet in several names:
- Look through the labels — names in different sectors can still share the same underlying driver.
- Size the concentration — see how much of the risk a handful of positions actually carry.
- Check before you add — test whether a new position diversifies the mix or doubles it down.
Turn insight into your next research step
Correlation and exposure pair naturally with the rest of your research — once you see the concentration:
- Replay through stress — run the portfolio through historical stress windows.
- Test a change — backtest how an alternative would have performed over a period you choose.
Start researching with QuantiBot.ai
🔒 Secure payment. No charge for 7 days. Cancel anytime.
For informational and educational purposes only. QuantiBot.ai is not a broker-dealer or investment adviser and does not provide investment advice.