AI investment research

Backtest, screen, and analyze stocks — just by asking.

Turn a question into real investment research — backtests, screens, and analysis using real market data. No spreadsheets, no code, no finance degree. Backtests, screens, and analysis from one question — no spreadsheets, no code.

Free to start — no card required. 10,000+ US stocks and ETFs.

Research that used to take an analyst — now in one question

QuantiBot.ai does the work between your question and the answer.

  1. Ask

    “Backtest a momentum strategy on SPY since 2015,” or “screen for cheap quality stocks.”

  2. QuantiBot.ai analyzes

    It runs the screen, backtest, or analysis on real daily market data — no black box.

  3. Get the answer

    A clear, written answer with the actual numbers, charts, and a table you can work from.

AI stock analysis & investment research

AI stock analysis, screening & backtesting — on real data

Every capability, on real daily US market data — free to try.

AI stock screener

Screen thousands of US stocks — just describe what you want

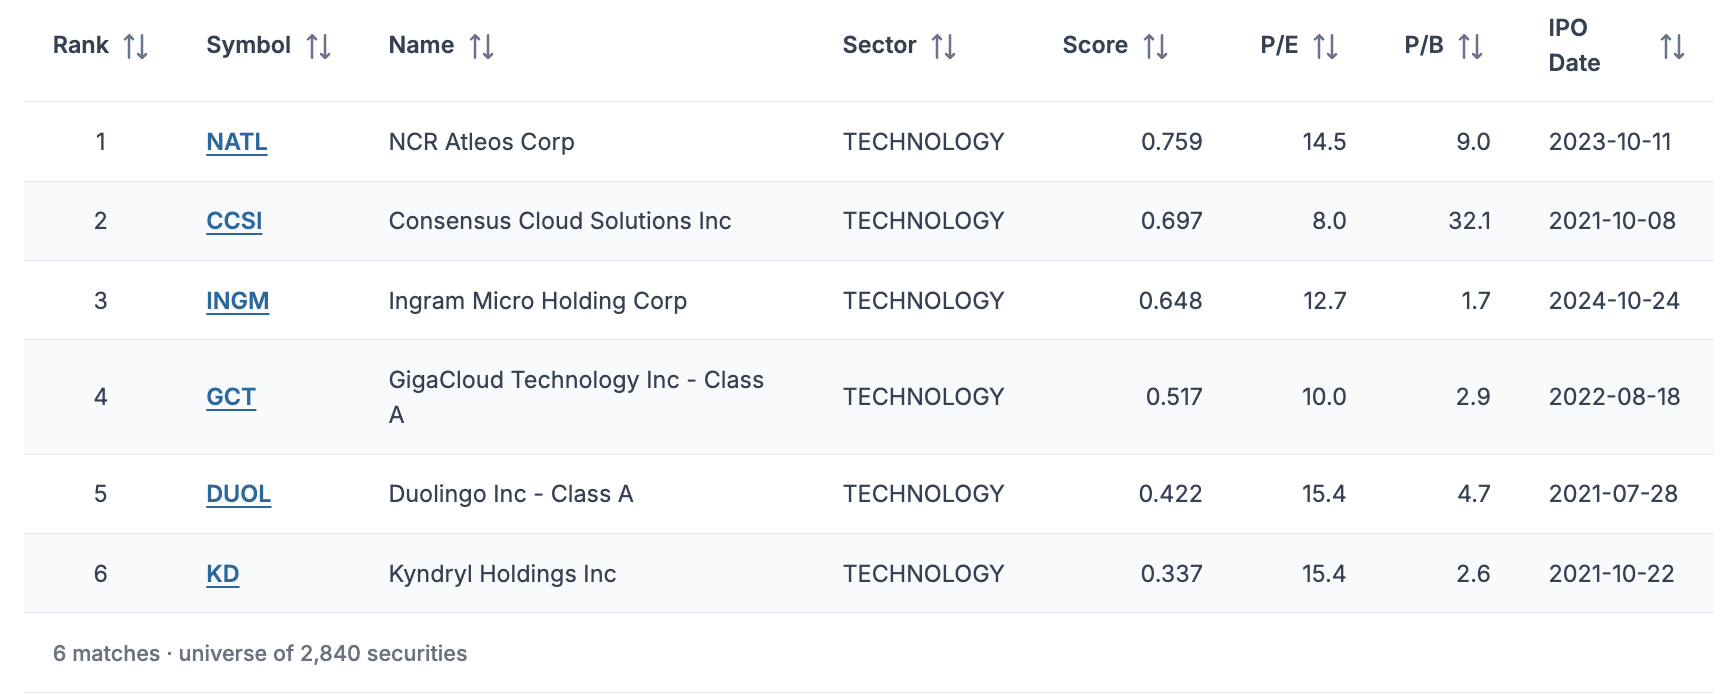
Filter by value, quality, momentum, and low-volatility factors — or just describe the kind of company you want.

Example“Quality compounders: ROE > 20%, margin > 40%” → 240 matches

Try the free stock screener
QuantiBot.ai stock screener results table — matching companies listed with their valuation, quality, and momentum metrics.
Sample screener rows
NATL NCR Atleos CorpP/E 14.5P/B 9.0
CCSI Consensus Cloud Solutions IncP/E 8.0P/B 32.1
INGM Ingram Micro Holding CorpP/E 12.7P/B 1.7
Backtesting

Backtest any strategy against every crash

Backtest a strategy or a whole portfolio across 2008, 2020 and 2022 — equity curve, drawdown, Sharpe, trade log.

Example$10k in AAPL · 50/200 MA cross · 2015–2025 → 13.1% CAGR

Try the free backtester
QuantiBot.ai backtest equity curve — the tested portfolio’s growth over the backtest window plotted against its benchmark.

13.1% CAGR

$10k in AAPL · 50/200 MA cross · 2015–2025

Portfolio X-ray

See what you actually own

Look-through overlap, concentration and sector/factor tilt across your holdings — the hidden risk two funds share.

ExampleVOO ∩ VGT: 31% overlap · 38% tech look-through

Try the free portfolio X-ray
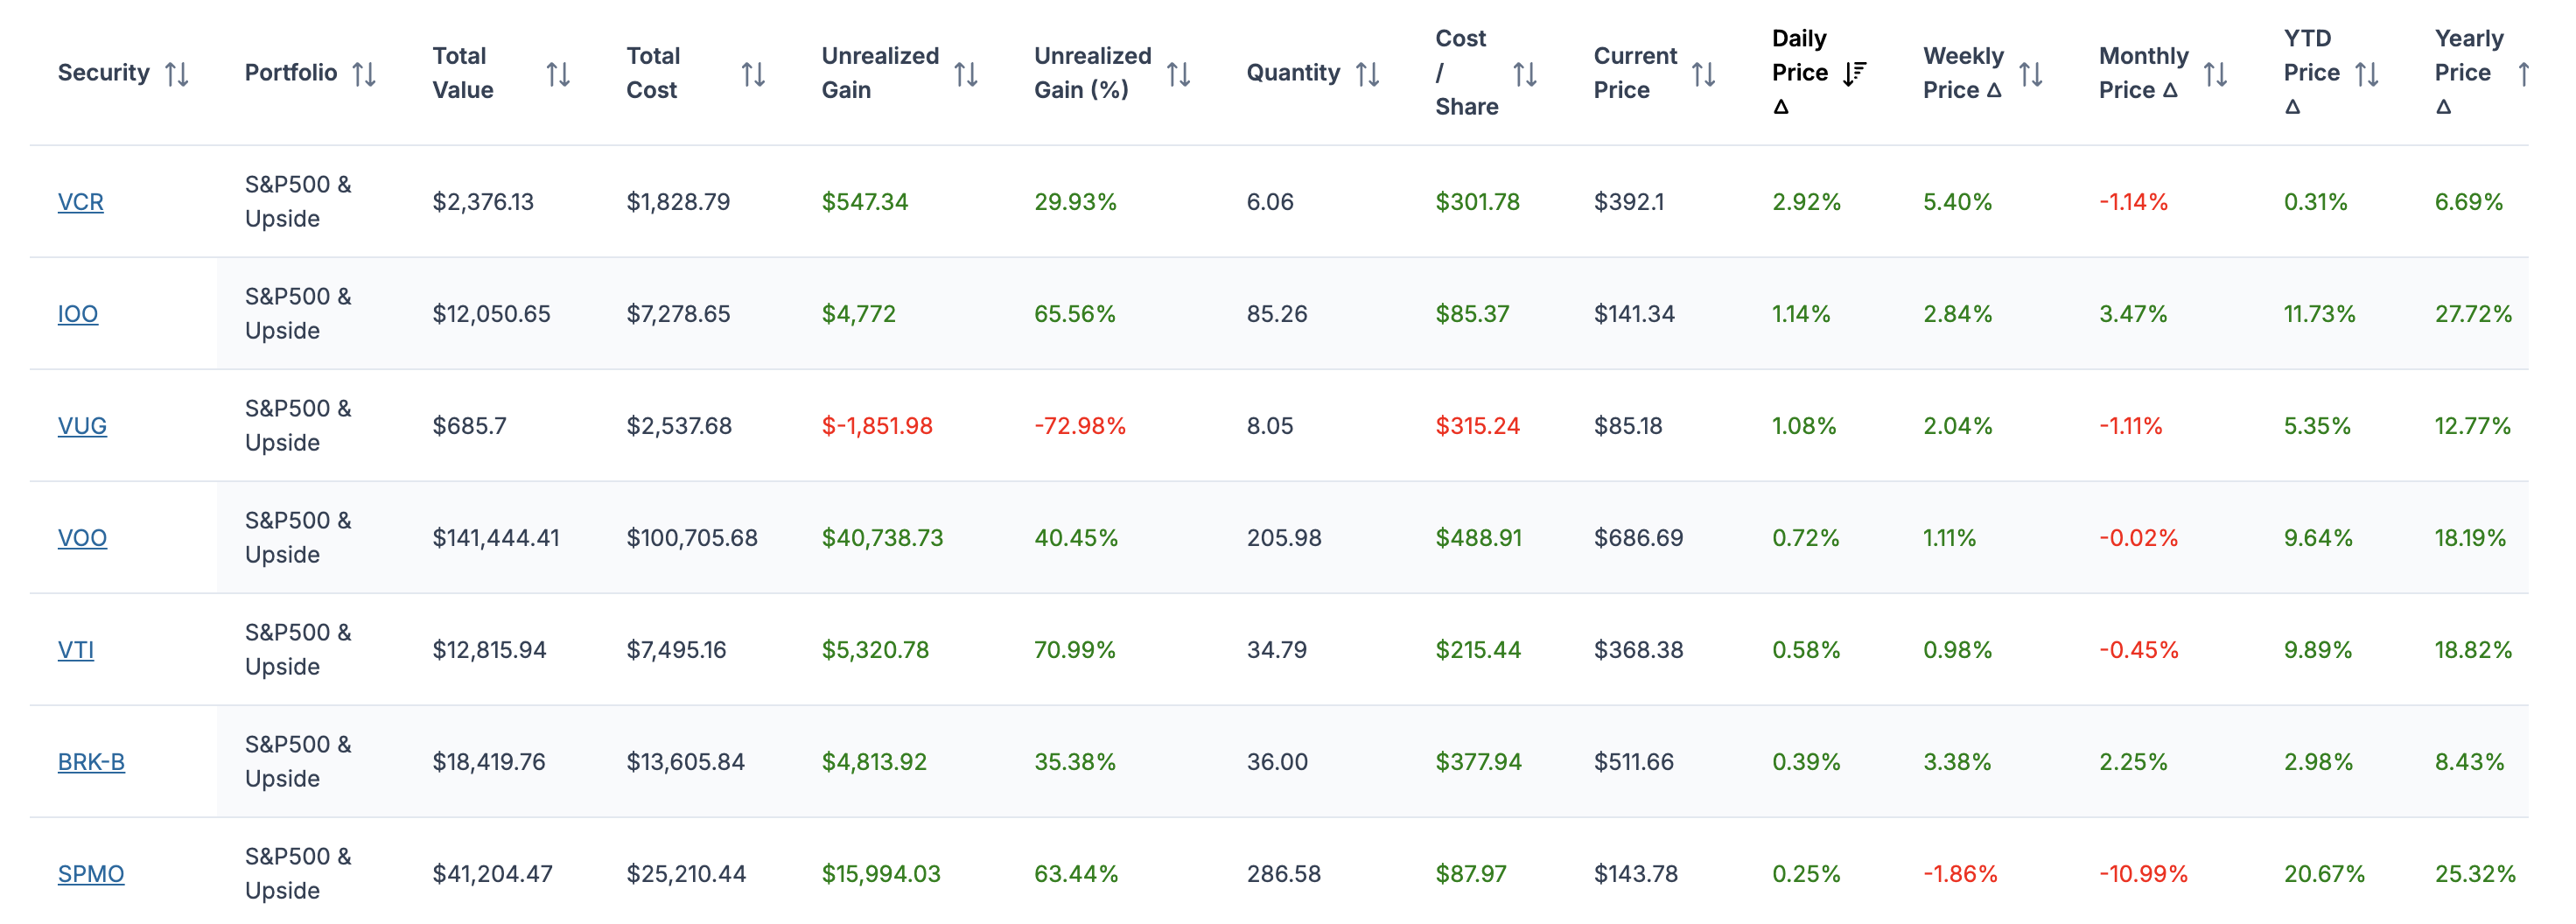
QuantiBot.ai portfolio holdings table — each position with its weight, value, and contribution to the portfolio.

Sample portfolio: VOO + VGT

  • Overlap between the two funds 31%
  • Total exposure to tech stocks 38%

Examples are illustrative. Past or hypothetical performance does not predict or guarantee future results. For informational and educational purposes only — not investment advice or a recommendation to buy, sell, or hold any security.

Start free. Upgrade when the answers are worth it.

Every tier runs on the full US market. No card to start · cancel anytime.

Free

Start researching — no card needed

$0.00/month
  • 3 AI research questions / week
  • Screener, stock/ETF backtesting & portfolio x-ray tools
  • Full daily US-market data
  • Unlimited watchlists, saved portfolios & accounts

Lite

The full toolkit, unlocked

$9.99/month
  • 15 AI research questions / week
  • Portfolio & advanced strategy backtesting
  • Custom signal screeners
  • Unlimited portfolio holdings
7-day free trialNew subscribers only

Pro

Full AI for serious research

$49.99/month
  • Everything in Lite
  • Hundreds of AI questions / month (fair-use)
  • Automated alerts
  • Priority email support

Ask your first stock question — free.

No card. No coding. Just answers, backed by the numbers.

No credit card required · Free plan for US residents