
Technical Analysis & Quantitative Signals
Read the technical picture without staring at a chart all day.
Ask QuantiBot.ai for the technical state of any security and get the indicators, patterns, and signals that matter — computed on live market data and explained in plain language, so you can interpret them for your research rather than eyeball them off a chart. It is a technical analysis tool that answers in sentences, not just lines on a graph. Every reading is computed fresh on current market data and returned with a plain-English read of what it means, so you can fold it into your own view rather than decode a chart.
🔒 Secure payment. No charge for 7 days. Cancel anytime.
- Conversational research
- No coding required
- For every investor
- Thousands of stocks & ETFs
- Company fundamentals
- Technical indicators
- Historical backtesting
The indicators you already use
Get live readings for the core technical indicators — and ask what they mean:
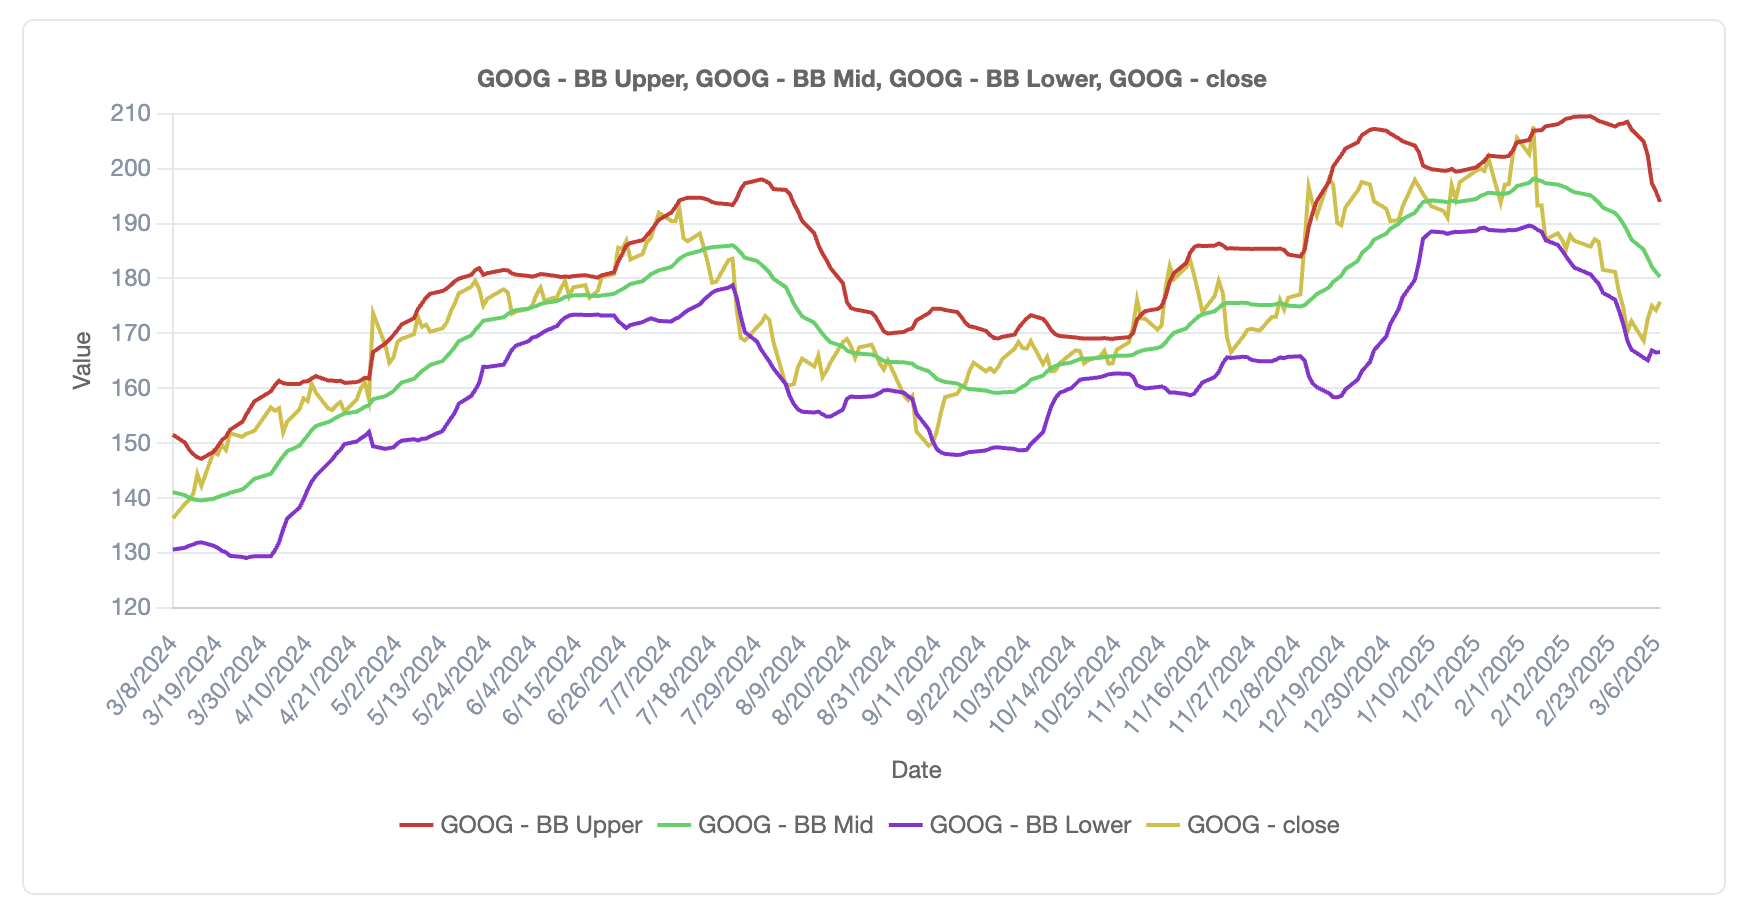
- RSI, MACD, Bollinger, ATR, Stochastic — on any stock or ETF.
- Explained, not just plotted — each reading comes with a plain-English interpretation.
- Ask in plain language — “is it overbought on RSI?” instead of memorizing thresholds.
- Set your own window — read the indicators over the period your question is about.
Candlestick pattern detection
Scan price history for candlestick patterns instead of hunting for shapes by eye:
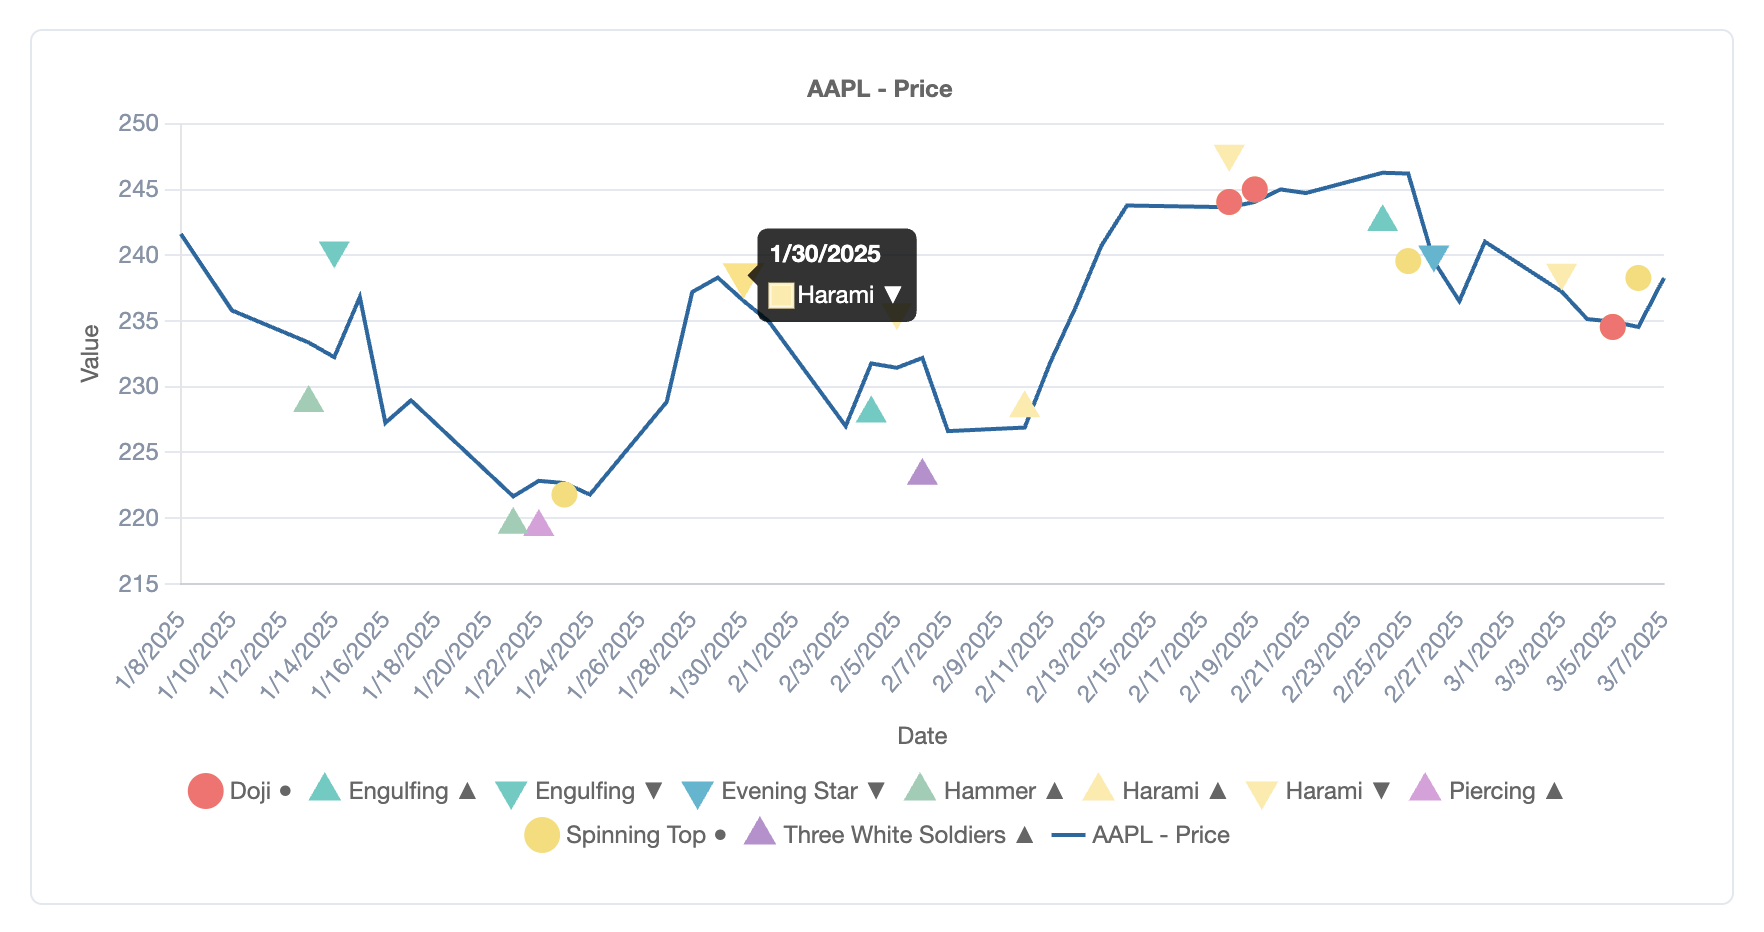
- A dozen patterns — doji, hammer, engulfing, morning and evening star, and more.
- Dated and directional — where each appears, with direction, over the window you choose.
- Your question, your scan — you set the window and the patterns to look for.
CoreSignals: QuantiBot.ai's own signal set
Beyond textbook indicators, CoreSignals characterize a name at a glance:
- Five dimensions — trend, quality, growth, momentum, and risk, as readable labels.
- A fast first read — characterize a security before you dig into the detail.
- Anchored to earnings — frame signal and pattern reads around upcoming earnings dates.
Frame the technicals around what's coming
Signals read differently ahead of a catalyst than in a quiet stretch. QuantiBot.ai puts the technical picture in context so a reading is easy to interpret:
- Earnings-aware — see where the next earnings date sits relative to the signals.
- Trend and momentum together — read direction and strength side by side, not one in isolation.
- Ask a follow-up — dig into any indicator or pattern in the same thread.
Start researching with QuantiBot.ai
🔒 Secure payment. No charge for 7 days. Cancel anytime.
For informational and educational purposes only. QuantiBot.ai is not a broker-dealer or investment adviser and does not provide investment advice.